Thanks to the vagaries of the Essex Libraries application of the Libraries Consortium interlending scheme I had to read a statistics book over Christmas (festive!) so it could be returned despite there being multiple copies of it on the shelf elsewhere. I would have been even more of a professional grump about it if the book was not the excellent “Art of statistics” by David Speigelhalter.
Being able to understand more about statistics is a skill that society at large would benefit from but that has a particular relevance for health information workers needing to support their users with appraising the research evidence. One of the things that brought me into health libraries was my enjoyment of modules on epidemiology and public health as part of my first degree. I also studied some statistics at A-level many moons ago so I started with some baseline. Many colleagues arrive in health libraries with nothing beyond memories of GCSE maths and other snippets they have picked up along the way which makes them nervous of venturing into this area. This is a shame as it is interesting stuff and provided we are not claiming to be statisticians we are in little danger.
Speigelhalter’s book is a great way for those with a little knowledge to reinforce it and for those without to build some base. My experience of facilitating sessions around critical appraisal is that what really helps is engaging examples that help people cut through their own worries about their lack of understanding of statistics. A significant number of excellent examples to work into your own practice are shared here – how might we have spotted Harold Shipman sooner? Can we predict whether someone would survive the sinking of the Titanic? Other more cheerful examples are explored but guided by these examples we are taken fairly briskly and in an accessible way through basic, and not so basic, concepts of statistics. Helpfully we find the same examples revisited later in the book with new possibilities opened up for reconsidering our questions and finding further helpful information.
We are encouraged to apply the PPDAC model in our thinking (image below but Problem, Plan, Data, Analysis, Conclusion and repeat essentially). PPDAC is a fine model for when we need to consider evaluating all manner of things. Plan is particularly useful with the text illustrating the pitfalls of people setting off without a plan and then “finding things” or modifying the plan in the light of interesting looking “findings”. A tempting path but not a statistically happy one.
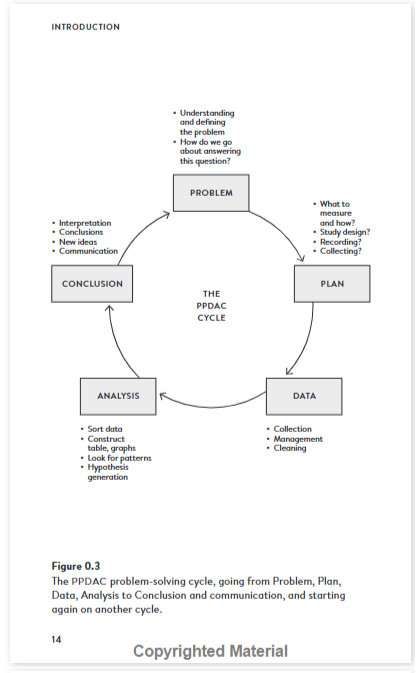
Image from the introduction of “The Art of Statistics” illustrating the PPDAC cycle
The closing chapters consider how things can go wrong and how they might be done better. They are rich with examples that will crop up in many of the papers we read.
Over at HILJ.Club I had a play recently with NotebookLM and, along with all the vocal fry in the audio podcast style summary, I was struck by how poorly the AI engaged with the statistics. Reading Speigelhalter brought back to me the importance of actually reading a paper to see all the things hidden away (and in plain sight), to get past the more or less accurate presentation in the abstract, to reflect on the sample used and all the glorious bits of bias that have found their way into the research. Stripping away this information to rapidly extract all the data tables say feels a rather risky plan.
I highly recommend this book to anyone but particularly to those who want to read research more effectively and to help others who need to do the same.
